Last Update: 2020-08-08
This question will resolve positively if the seven day simple moving average of daily confirmed deaths in the US reaches or exceeds 6.40 deaths per million any day after 2020-07-22 but before 2021-01-01. Resolution will be determined using data reported by the Covid Tracking Project US Historical Data under the ““deaths”” column. The population of the US will be assumed to be 328.2 Million.
Current Prediction
- July 5th, 2020: 0.56
- July 12th, 2020: 0.73
- August 8th, 2020: 0.39
Resolution: 1.00, there was a second wave at least as deadly as the first.
Updates
2020–08-08
- Many of my updates for a second wave occurring haven’t panned out. The Rt in hotspot states has fallen. The spread to older populations has largely plateaued or reversed. And the second wave of deaths looks to have peaked. My current view is that in order to have a wave of deaths as bad as the first, the virus needs to quickly spread in a way that we haven’t seen since the beginning of the pandemic. At this point, it seems that we have the tools to keep that from happening.
- I’ve increased my credence in projections that do not show a second peak of deaths worse than the first. Further, more and more data is pointing to the idea that both the IFR and herd immunity thresholds have dropped significantly.
- My biggest remaining worry is that there will be a second peak in the fall due to schools reopening and the weather getting colder, which would force people to gather indoors. This is a moderate, but not strong update, because I believe if schools do become a source of spread, they will be shut down. Also, this would mainly cause spread in younger age groups.
2020-07-12
- covid19-projections has extended their projections to November 1st and Los Alamos has extended out to September 1st, so I’ve lowered my credence that a second wave could come after the projected period.
- I’ve lowered my credence in covid19-projections. The recent increase in deaths was outside their confidence interval. It hasn’t been a increase long enough to drag the rolling average outside the confidence interval, but I now think their projections are an underestimate.
- Increasing hospitalizations increases my credence that there will be a deadly second wave.
- Increasing cases in long-term car facilities increases the chance of a deadly second wave.
- I added some images.
Base Rate
In the past, how frequently have pandemics had consecutive waves that were more deadly than the first?
SARS (2003) and MERS (2018)
SARS and MERS were quickly brought under control, but there were multiple setbacks. With MERS, the first peak was the worst.1 With SARS, the second peaks were worse.2 Both of these epidemics were of a much smaller scale.
Odds:1:1
H1N1 (2009)
H1N1 had two peaks larger than the first that occurred about 9 to 10 weeks after the initial peak. This epidemic was on the same scale as COVID, but there were no lockdowns. There was a vaccine very quickly.
Odds: 1:0
Spanish Flu (1918)
The 1918 Spanish Flu had three waves. The second wave was the deadliest in the US. It’s unclear why this was. It might have mutated to a deadlier strain, which is maybe less likely with COVID (coronaviruses are less likely to mutate significantly).
Odds: 1:0
London Flu (1972)
The 1972 London Flu had an initial wave starting in December 1972 into early 1973, but no second wave exceeding the first in the US.3
Odds: 0:1
Hong Kong Flu (1968)
The 1968 Hong Kong flu also only had one peak in the United States,4 but Europe and Japan had a different pattern with a second more deadly peak.5
Odds: 2:1
Asian Flu (1956)
The 1956 Asian Flu: “Of the 39 countries, the impact on excess mortality in 18 (44%) was delayed to the second or third year of pandemic virus circulation. In Europe and Australia in particular, the majority of influenza-related deaths occurred in the third year of pandemic influenza A(H2N2) virus activity.”6
Odds: 18:21
Total Historical Prior: 23:24
Updates Against
Projections
The most reliable projections do not project a second spike in deaths. See here for an evaluation of historical performance.
covid19-projections.com projects a second wave of infections worse than the first, but not a second wave in deaths. This is due to assumptions about the IFR and Rt.
It expects the IFR to drop over the course of the pandemic. This seems like a reasonable expectation given treatments like dexamethasone, which cut mortality by 20% to 30%.7
Since June 1, 2020, we use a variable IFR that decreases over time to reflect improving treatments and the lower age distribution of cases.
The second assumption is that once lockdowns are lifted, Rt will rise to 0.8-1.2, which is substantially lower than Rt estimates in places like NYC when the pandemic began. I think there’s something to this. I’m not sure if 1.2 is the right number, but I see the following evidence that people are being more cautious than they were at the beginning of the outbreak:
- Mobility data: Fewer people are using public transit according to Apple mobility data.
- Less people are making reservations on Open Table.
- There are stronger social norms around mask usage.
Here is how covid19-projections explains it:
We assume that infection rates will increase by approximately 0-30%, resulting in an R of around 0.8-1.2. This is based on analysis of R values in regions where there were no lockdowns, such as Sweden and South Dakota. Note that this is still a lower infection rate than what it was prior to the outbreak for most regions.
covid19-projections.com projects to the end of October 2020.
Los Alamos has also produced reliable estimates. They project out to the end of August, and do not foresee a second wave deadlier than the first, even in a 95th percentile scenario.
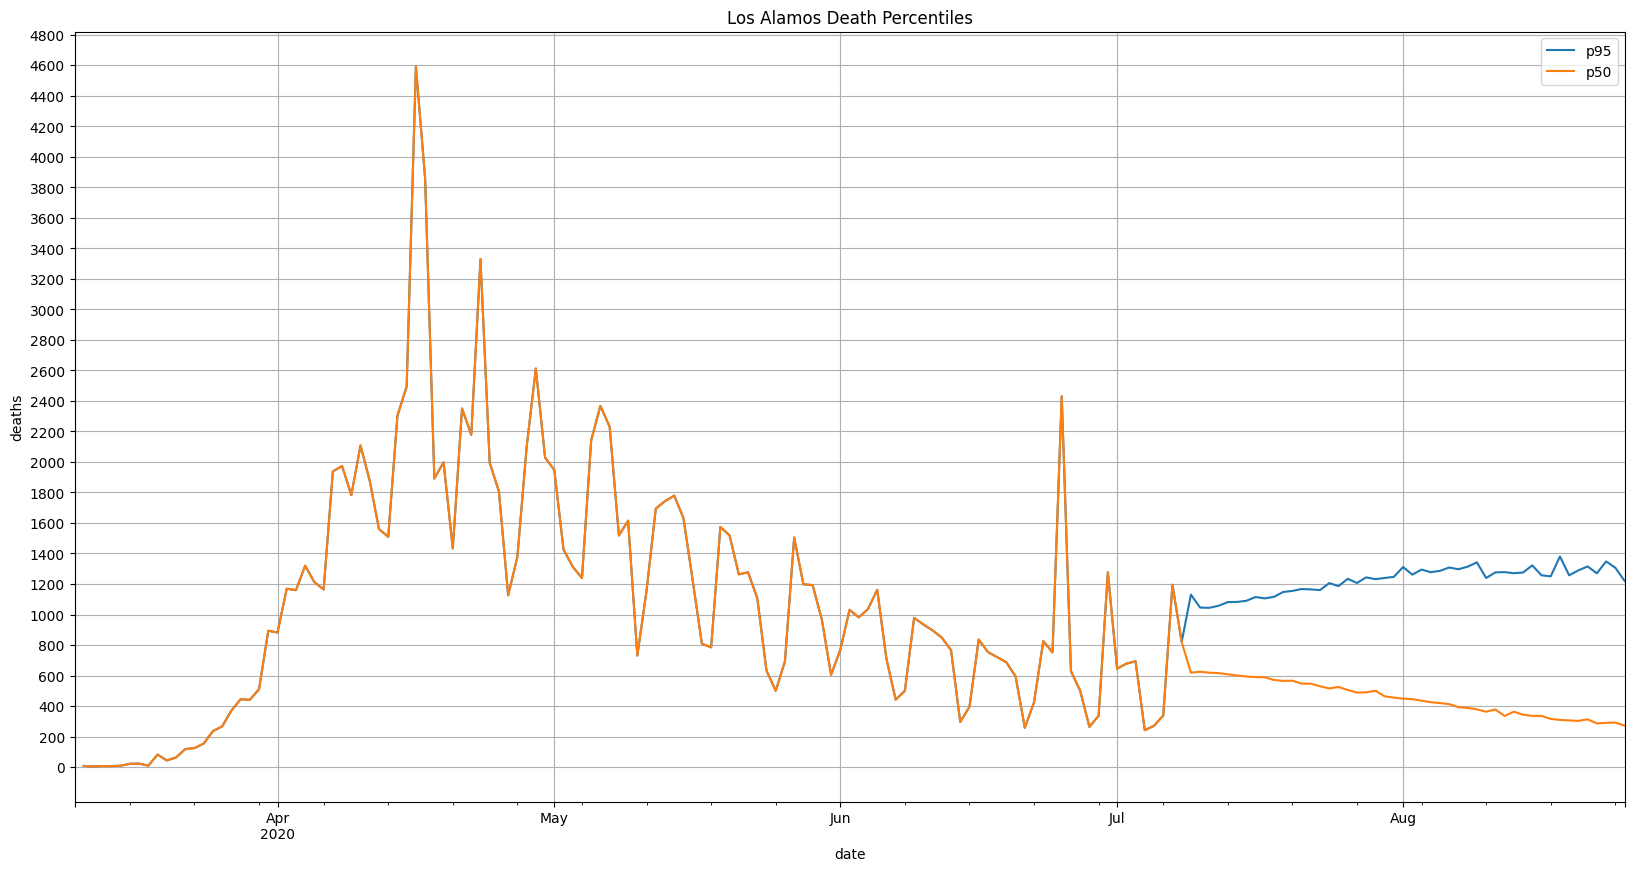
So this is a strong update that, at least until September or November there won’t be a second wave of deaths exceeding the first.
Update: 1:3
Updates For
Because my main evidence against the hypothesis is existing models, in this section I try to think about where these models might go wrong.
Second wave could come after the currently forecast period
Neither of the projections I’ve looked at forecast to the end of the year. covid19-projections forecasts until the end of November 1st, and Los Alamos forecasts until September 1st. Suppose they are right that we’ll make it until September or November without a second wave. That still leaves 2 to 4 months for a second wave to occur. There are some reasons to believe the fall will be tough:
- More people indoors. Outdoor dining and backyard BBQs won’t be an option in many places.
- People will travel for the holidays.
- Flu season will further strain hospitals.
- Fatigue further eats away at our collective will to social distance.
- Schools reopening in the fall.
Pushing back against this, I think as time goes on we’re likely to get better at treating this disease and coping with the current reality. I’m pretty uncertain about this, so for now this is a small update.
Update: 2:1
https://www.who.int/emergencies/mers-cov/maps-september-2017/en/↩︎
https://www.who.int/csr/sars/epicurve/epiindex/en/↩︎
https://stacks.cdc.gov/view/cdc/286/↩︎
https://stacks.cdc.gov/view/cdc/282↩︎
https://academic.oup.com/jid/article/192/2/233/856805↩︎
https://academic.oup.com/jid/article/213/5/738/2459470↩︎
https://www.who.int/news-room/q-a-detail/q-a-dexamethasone-and-covid-19↩︎